Capturing Energy Data in Buildings: The Five Biggest Hurdles
Capturing energy data in buildings often fails on heterogeneous meters and manual workflows. Five hurdles – and a pragmatic, staged way forward.
Why capturing energy data in buildings is so demanding
Anyone trying to compile reliable energy data for a building portfolio quickly runs into a reality that never shows up on consulting slides. Meters sit in boiler rooms where the keys have long been lost. Caretakers report values via WhatsApp without indicating whether the reading refers to the first of the month or to the day it was actually taken. Distribution network operators send PDF load profiles in formats that differ from region to region. And at the end of the quarter, the asset manager asks for consumption data – with the legitimate expectation that it must be audit-ready.
With the reporting obligations from **CSRD** and **EnEfG** and the audit pressure from **ISO 50001**, this reality is no longer sustainable. Energy data is no longer a nice-to-have but a mandatory component of reporting. Anyone failing to capture it systematically risks not a "small delay" but formal audit findings and, at worst, regulatory sanctions.
> We often did not know at quarter-end whether a value from one of our sites was actually missing – or whether the caretaker had simply not forwarded it yet.
The five biggest hurdles in detail
Discovery conversations with energy managers and facility managers consistently surface five recurring hurdles. They appear regardless of industry, portfolio size and geographical distribution.
Hurdle 1: Heterogeneous meter and sensor landscape
Each building typically hosts five to fifteen meters across different media – electricity, gas, water, district heating, pellets, compressed air. Manufacturers range from Landis+Gyr through Itron, ABB, EMH to Kamstrup. Communication protocols are at least as varied: M-Bus, MODBUS, OPC-UA, KNX, BACnet, LoRaWAN, NB-IoT. A homogeneous interface does not exist – and it will not emerge in the next decade.
Hurdle 2: External service providers without platform access
The people who actually take the readings are rarely in-house energy managers. They are caretakers, external FM providers, maintenance technicians, service partners. They are supposed to capture data but should not receive a full platform login – for both licensing and compliance reasons. The result: Excel mailings, WhatsApp photos and handwritten notes dominate, all of which someone has to digitise retroactively.
Hurdle 3: Energy suppliers as closed data silos
Distribution network operators often provide load profile data exclusively via web portals. Each site requires its own credentials, each region uses a different format, and automated interfaces are rare. Anyone retrieving quarterly load profiles for a 50-site portfolio spends a full working day on login switching and Excel downloads alone.
Hurdle 4: Submetering does not pay off everywhere
The theoretical solution – every relevant consumer gets a digital submeter – fails in practice on economic grounds. A comprehensive submetering installation can quickly cost a mid five-figure sum per property without the investment amortising through energy savings alone. For many smaller sites or existing buildings, full sensor coverage simply does not pay off – yet the reporting obligation still applies.
Hurdle 5: Missing data context and comparability
Even when consumption figures are complete, the question remains: are they high or low? A kWh value alone says nothing. Comparability only emerges through reference variables: kWh per square metre, kWh per employee, kWh per produced unit. Add to this weather correction via heating degree days, without which winter months are perpetually interpreted as "high consumption". This context data is missing from most energy ledgers.
How the EDM Toolbox addresses this
The EDM Toolbox does not approach the problem through a single large sensor installation project. Instead, it works through progressive maturity levels. The idea: every property starts at the lowest possible maturity level, immediately generates usable data, and only moves up to higher levels as needed.
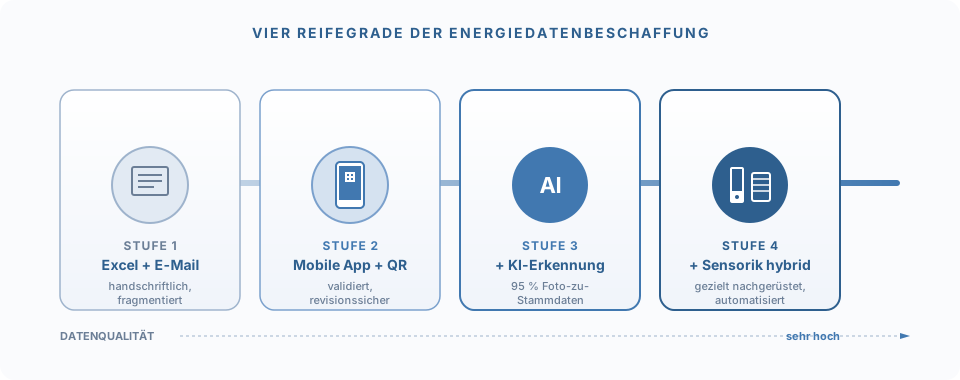
This logic avoids the classic "big-bang sensor project" that, in practice, often fails or runs years behind schedule.
Layer 1: Mobile capture as a hardware-free entry point
Instead of installing sensors first, the EDM Toolbox enables immediate capture via the mobile app. QR code on the meter, photo of the reading, OCR recognition. Within two weeks, first validated values are available for all sites – without a single sensor installation.
Layer 2: AI-powered meter recognition for inventory
Initial inventory of the meter landscape is normally the biggest time sink. The EDM Toolbox uses **Google Gemini Vision** to extract manufacturer, model, medium, pulse value and transformer factor automatically from a single photo of the nameplate. Per meter, this reduces the effort from 15 to 30 minutes to a few seconds – at a recognition rate of over 95 percent.
Layer 3: External capture without full login
Caretakers and external service providers receive **token-based access** that only shows and writes to the metering points assigned to them. No backend login, no licensing costs, no compliance risks. Capture, confirm, move to the next site – immediately documented in an audit-proof manner and without any retrofitting in Excel.
Layer 4: Targeted sensor retrofitting
Once the data foundation is in place and concrete hotspots are identified, sensors can be retrofitted selectively. A boiler with particularly volatile consumption gets an automatic M-Bus logger, a branch with high electricity demand gets a Modbus gateway. Master data, evaluation logic and reporting structures are already in place – the sensor only feeds data into an existing framework.
Maturity levels compared
| Maturity level | Data quality | Capture effort | Investment |
|---|---|---|---|
| Excel + email | low | high | minimal |
| Mobile app + QR | medium-high | medium | low |
| Mobile + AI recognition | high | low | low |
| Hybrid + targeted sensors | very high | minimal | medium |
| Fully automated | very high | minimal | high |
In most portfolios, levels 2 and 3 prove to be the economic sweet spot. Level 4 pays off selectively for particularly relevant or volatile consumers – it is not an end in itself.
Practical implementation – where to start
1. **Site inventory:** Capture on a single page which properties belong to the portfolio, which media are consumed and which compliance requirements apply.
2. **Maturity analysis:** Determine the current data acquisition maturity level for each property – honestly, not aspirationally.
3. **Choose a pilot site:** Start with a property that is typical of the bulk of the portfolio, not with the most difficult one.
4. **Roll out the platform:** Get mobile capture productive across all sites within two to three weeks. Only then discuss next steps.
5. **Retrofit sensors selectively:** Identify, based on three months of real data, the exact points where submetering pays off economically.
Conclusion
Capturing energy data in buildings is not solved by a single solution – and that is the most common strategic misconception. Anyone waiting for the big sensor rollout loses years during which they should already be fulfilling reporting obligations, identifying efficiency potential and passing audits.
The EDM Toolbox enables a hardware-free start, builds up the data foundation step by step and integrates sensors where they make economic sense. For facility managers, asset managers and energy managers, this means: reliable data within weeks instead of years, audit-ready for CSRD, EnEfG and ISO 50001, and with an investment profile that follows actual added value – not the other way around.